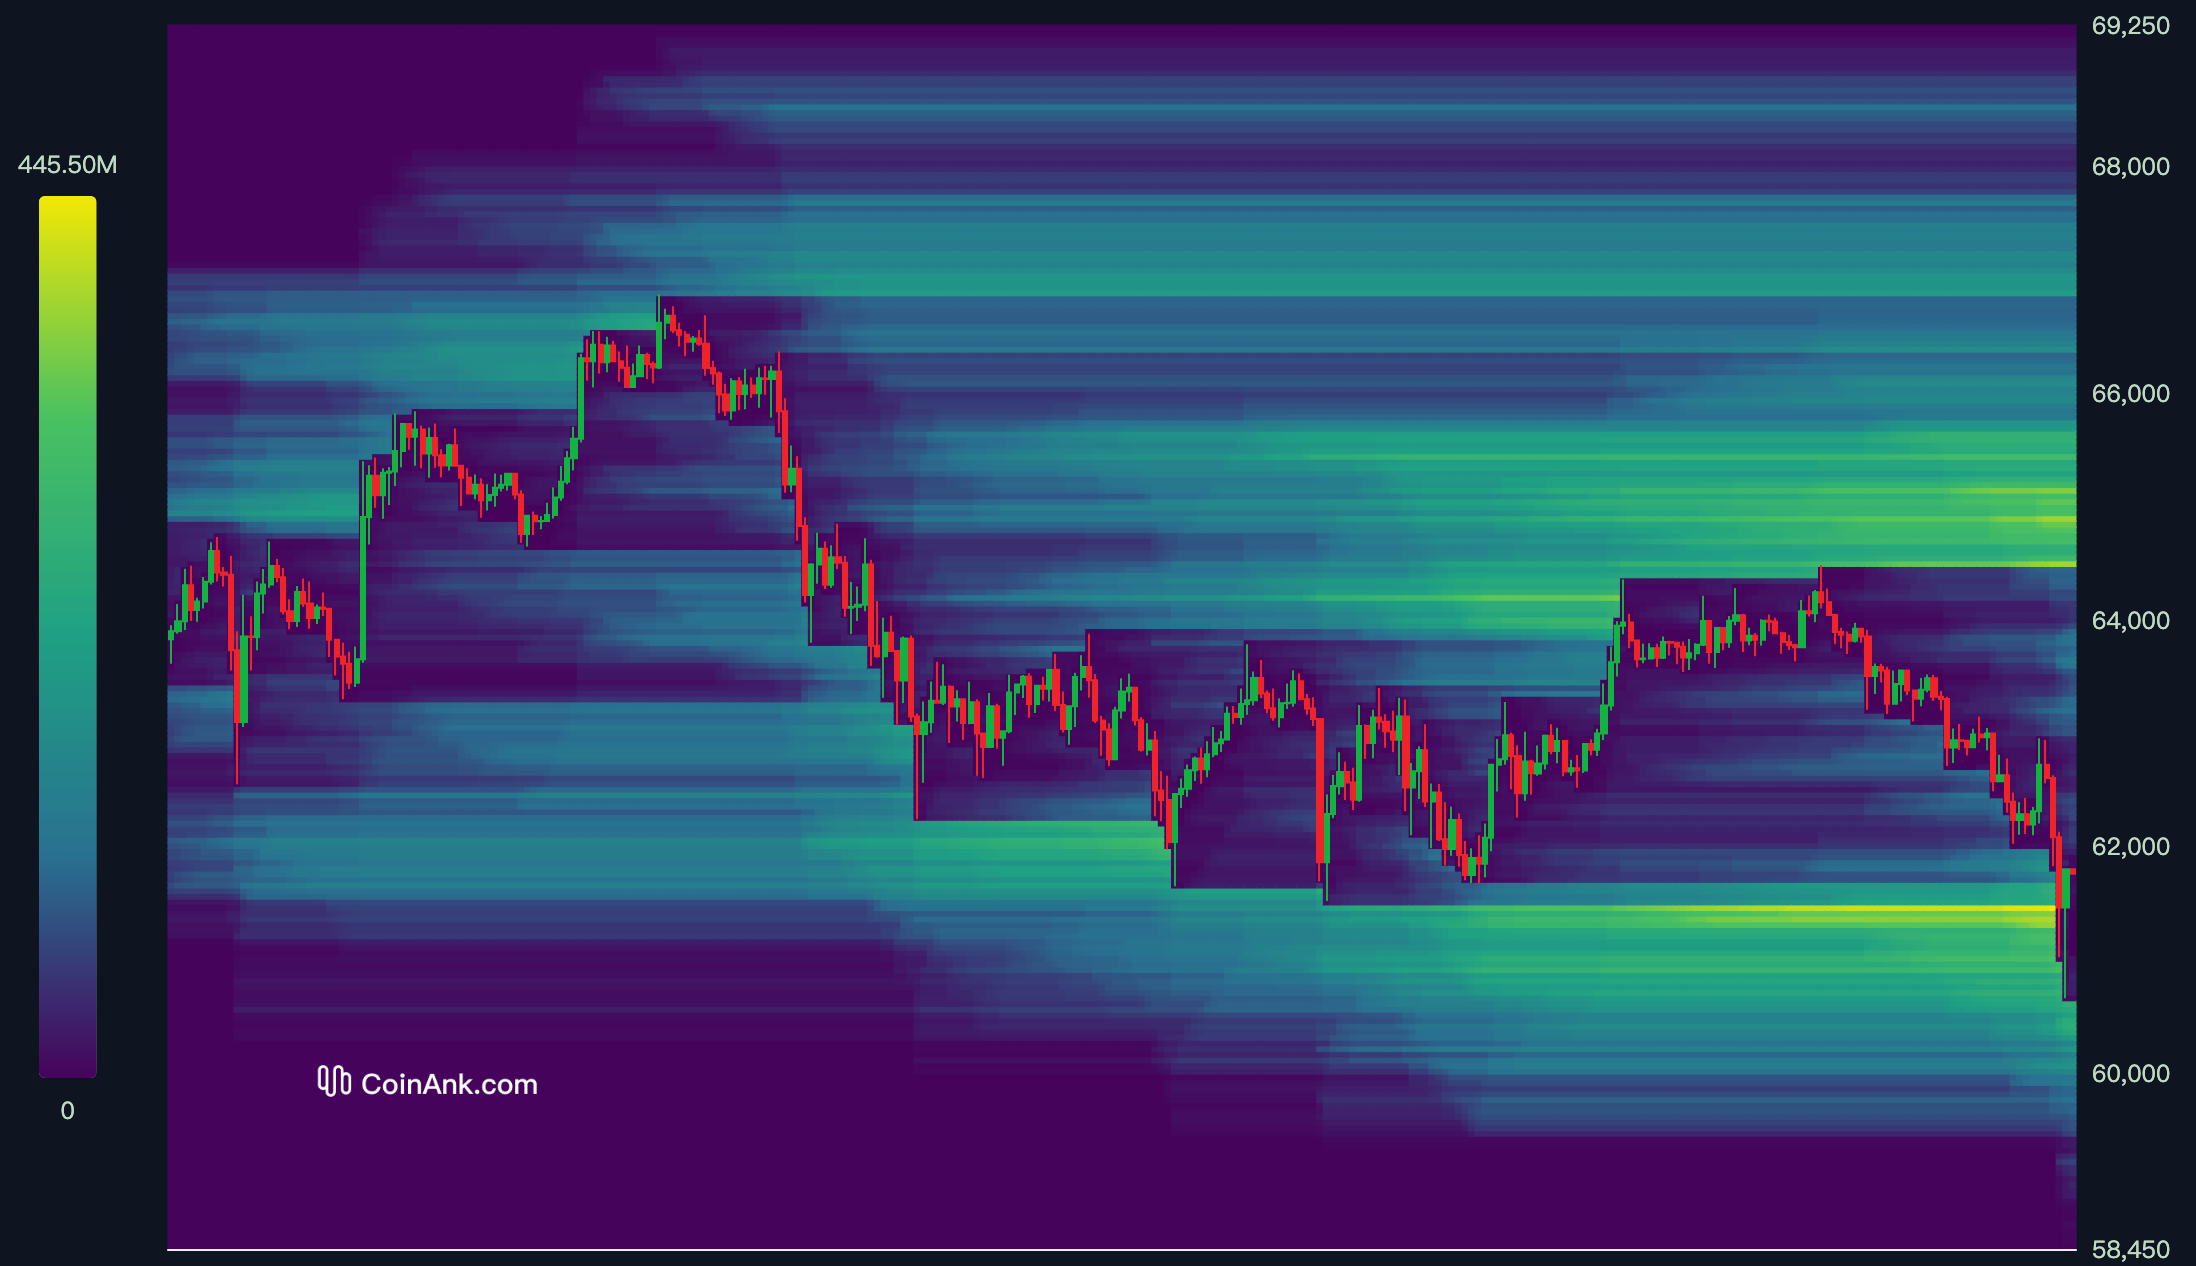
Liquidation Heatmap
Estimated price levels predicting where liquidation events may occur
Background
A liquidation event occurs when a trader's position is closed out due to the price moving against them and their margin account balance becoming insufficient to cover their open positions. To prevent further losses to the trader and the exchange, most exchanges provide the liquidation level, which is the price at which the trade would be liquidated when entering a leveraged trade.
Traders who can estimate the locations of other traders' liquidation levels may gain an advantage similar to knowing high liquidity in the order book. The Liquidation Heatmap by Coinank attempts to predict where large liquidations may occur to assist traders.

Overview
The Liquidation Heatmap calculates the liquidation levels based on market data and different leverage amounts. The calculated levels are then added to a price bucket on the chart.
As more estimated liquidation levels are added to a certain price the color of the heatmap changes. The color scale ranges from black to yellow, where yellow represents high amount of predicted liquidation levels, allowing traders to identify areas of high liquidity.
The Liquidation Heatmap predicts where liquidation levels are opening but not closing. Thus, the actual number of liquidations will be lower. When looking at the size, it's essential to read it as a relative number by comparing it to the other levels.
Users can filter on multiple major exchanges, ticker, and the level of lookback.
Lookbacks Support:
- 12 Hours
- 1 Days
- 3 Days
- 7 Days
- 14 Days
- 1 Month
How traders use this
The Liquidation Heatmap enables traders to identify areas of high liquidity, which can be helpful in different ways:
Magnetic Zones:
A high concentration of potential liquidation levels at a specific price range may indicate that price might move toward that region. Some traders use these pockets of liquidation levels as a way to gauge which way price is more likely to head towards along with other indicators that may be used as confluence.
Support / Resistance Zones:
At high liquidation zones, bigger traders "whales" can execute trades quickly and at a favorable price. Once they have entered or exited their orders in this liquidity and price can now reverse.
In addition liquidation levels can cause massive pressure on either the buy side or sell side of the orderbook causing price to naturally reverse.
Liquidations play a crucial role in the cryptocurrency market, as they can have a significant impact on traders' positions. By understanding how to utilize the data, traders can make informed trading decisions and potentially increase their chances of success
Nội dung tin tức không cấu thành lời khuyên đầu tư, nhà đầu tư nên tự ra quyết định và chịu rủi ro.