 BTCMarket Cap:
 Liquidación
  Mapa Calor Liquidaciones
 '/%3e%3cdefs%3e%3clinearGradient%20id='paint0_linear_5641_7353'%20x1='7.9999'%20y1='0'%20x2='7.9999'%20y2='16'%20gradientUnits='userSpaceOnUse'%3e%3cstop%20stop-color='%23F1424B'/%3e%3cstop%20offset='1'%20stop-color='%23F17F42'/%3e%3c/linearGradient%3e%3c/defs%3e%3c/svg%3e)
 Liquidation Map
 '%3e%3cpath%20fill-rule='evenodd'%20clip-rule='evenodd'%20d='M10.6917%2011H20.7275C21.4777%2011%2022.0862%2011.6085%2022.0862%2012.3587V20.5023C22.0862%2021.2525%2021.4777%2021.861%2020.7275%2021.861H10.6917C9.94149%2021.861%209.33301%2021.2525%209.33301%2020.5023V12.3587C9.33301%2011.6085%209.94149%2011%2010.6917%2011ZM13.6174%2012.7838C12.7422%2012.7838%2012.0253%2013.5006%2012.0253%2014.3758C12.0253%2015.251%2012.7422%2015.9679%2013.6174%2015.9679C14.4926%2015.9679%2015.2095%2015.251%2015.2095%2014.3758C15.2095%2013.5006%2014.4926%2012.7838%2013.6174%2012.7838ZM12.6588%2018.6519C12.4504%2018.8686%2012.4504%2019.2104%2012.6588%2019.4187C12.8672%2019.6271%2013.209%2019.6271%2013.4257%2019.4187L18.6603%2014.1841C18.8687%2013.9674%2018.8687%2013.6256%2018.6603%2013.4173C18.4436%2013.2089%2018.1018%2013.2089%2017.8935%2013.4173L12.6588%2018.6519ZM16.1347%2018.4852C16.1347%2019.3604%2016.8515%2020.0772%2017.7267%2020.0772C18.6103%2020.0772%2019.3188%2019.3687%2019.3188%2018.4852C19.3188%2017.61%2018.602%2016.8931%2017.7267%2016.8931C16.8515%2016.8931%2016.1347%2017.61%2016.1347%2018.4852ZM17.1513%2018.4853C17.1513%2018.1685%2017.4097%2017.9101%2017.7265%2017.9101C18.0432%2017.9101%2018.3016%2018.1685%2018.3016%2018.4853C18.3016%2018.802%2018.0432%2019.0604%2017.7265%2019.0604C17.4097%2019.0604%2017.1513%2018.802%2017.1513%2018.4853ZM13.6171%2013.8008C13.9339%2013.8008%2014.1923%2014.0592%2014.1923%2014.3759C14.1923%2014.6927%2013.9339%2014.9511%2013.6171%2014.9511C13.3004%2014.9511%2013.042%2014.6927%2013.042%2014.3759C13.042%2014.0592%2013.3004%2013.8008%2013.6171%2013.8008Z'%20fill='white'/%3e%3c/g%3e%3c/svg%3e) Financiación
Financiación  Financiación Heatmap
  Accumulated Funding Rate
  Proporción de Largo/Corto
  L/S Population ratio
  Mejor Trader Largo/Corto
  Binance Mejor Trader
  Huobi Mejor Trader
  OKX Mejor Trader
  OpenInterest
  RSI Heatmap
  Visual Screener
  Orderbook Depth Delta
  Full Price Orderbook
  Aggregation Orderbook
 '%3e%3cpath%20d='M20.8256%2011.3737C18.948%2010.28%2018.9199%209.09498%2015.8948%208.07426C15.6842%208.00326%2013.9787%207.71512%2015.2786%209.07923C15.842%209.81132%2015.4279%2010.178%2014.7905%2010.4269C14.3153%2010.6125%2013.8044%2010.7051%2013.3137%2010.8538C9.88153%2011.8935%207.15065%2014.816%207.0828%2018.2744C6.93667%2018.5015%206.80144%2018.6847%206.72293%2018.8289C6.49853%2019.2408%206.28188%2019.6094%206.12896%2020.0483C5.84882%2020.8521%206.06668%2021.6661%206.3856%2022.4234C6.45103%2022.5788%206.53851%2022.5695%206.66889%2022.4326C6.82592%2022.2678%206.93982%2022.1006%207.11188%2021.9521C7.40631%2021.6979%207.77224%2021.4747%208.05577%2021.2096C8.44545%2020.8453%208.83827%2020.2819%208.54917%2019.3446C9.35954%2020.4852%2010.3735%2020.1787%2011.0152%2020.2698C11.0542%2020.2754%2011.0864%2020.24%2011.0777%2020.2017C10.8557%2019.2144%209.5488%2018.9646%208.57098%2017.8581C8.95605%2017.2859%209.41285%2016.7957%209.84445%2016.4581C11.4601%2015.3407%2014.7246%2016.175%2014.8499%2018.2436C14.7808%2018.8117%2014.3909%2019.394%2013.8575%2019.9252C13.6879%2020.0948%2013.9433%2020.1573%2014.0962%2020.1573C15.8536%2020.1891%2015.6387%2019.7001%2016.6109%2019.521C17.5832%2019.3421%2018.4471%2021.1909%2021.5136%2021.6145C24.5801%2022.0381%2025.1222%2020.4789%2025.1222%2019.0438C25.1225%2016.1876%2023.4109%2012.8795%2020.8256%2011.3737ZM21.2306%2018.7181C21.1412%2019.2954%2020.7721%2019.646%2020.252%2019.3598C19.8456%2019.1364%2019.4506%2018.8863%2019.0682%2018.6175C18.6858%2018.3488%2018.3155%2018.0616%2017.959%2017.7636C17.4991%2017.3792%2017.9922%2016.352%2019.0735%2016.3864C20.3463%2016.4203%2021.3927%2017.6705%2021.2306%2018.7181Z'%20fill='white'/%3e%3c/g%3e%3cdefs%3e%3cclipPath%20id='clip0_8863_31880'%3e%3crect%20width='20'%20height='20'%20fill='white'%20transform='translate(6.00006%206)'/%3e%3c/clipPath%3e%3c/defs%3e%3c/svg%3e) Hyperliquid Whale Tracker (Real-Time)
Hyperliquid Whale Tracker (Real-Time) '%3e%3cpath%20fill-rule='evenodd'%20clip-rule='evenodd'%20d='M10.873%209.72527C10.588%209.72517%2010.3146%209.83815%2010.1129%2010.0394C9.91111%2010.2407%209.79746%2010.5138%209.79688%2010.7988V21.8696C9.79746%2022.1545%209.91106%2022.4275%2010.1127%2022.6288C10.3144%2022.83%2010.5877%2022.9431%2010.8726%2022.9431H20.9314C21.2151%2022.9412%2021.4866%2022.8274%2021.6868%2022.6263C21.8869%2022.4253%2021.9995%2022.1533%2022.0001%2021.8696V13.1159H19.4932C19.4462%2013.1159%2019.3997%2013.1066%2019.3563%2013.0887C19.3129%2013.0707%2019.2735%2013.0443%2019.2403%2013.0111C19.207%2012.9779%2019.1807%2012.9385%2019.1627%2012.8951C19.1447%2012.8517%2019.1355%2012.8052%2019.1355%2012.7582V9.72527H10.873ZM22.0001%2012.0494L20.1697%209.72527V12.0494H22.0001ZM13.3176%2013.2338C13.6438%2013.2338%2013.8614%2013.4514%2013.8614%2013.7776C13.8614%2014.1038%2013.6438%2014.3214%2013.3176%2014.3214H11.3693C11.0431%2014.3214%2010.8255%2014.1038%2010.8255%2013.7776C10.8255%2013.4514%2011.0431%2013.2338%2011.3693%2013.2338H13.3176ZM15.3564%2011.2669C15.6826%2011.2669%2015.9002%2011.4845%2015.9002%2011.8107C15.9002%2012.1369%2015.6826%2012.3545%2015.3564%2012.3545H11.3693C11.0431%2012.3545%2010.8255%2012.1369%2010.8255%2011.8107C10.8255%2011.4845%2011.0431%2011.2669%2011.3693%2011.2669H15.3564ZM13.6842%2016.5257C13.6842%2015.7793%2014.2956%2015.168%2015.042%2015.168C15.7884%2015.168%2016.3998%2015.7793%2016.3998%2016.5257C16.3998%2017.2722%2015.7884%2017.8835%2015.042%2017.8835C14.2956%2017.8835%2013.6842%2017.2722%2013.6842%2016.5257ZM14.2245%2020.8265C14.0468%2020.6488%2014.0468%2020.3574%2014.2245%2020.1725L18.6888%2015.7082C18.8665%2015.5305%2019.158%2015.5305%2019.3428%2015.7082C19.5205%2015.886%2019.5205%2016.1774%2019.3428%2016.3622L14.8785%2020.8265C14.6937%2021.0043%2014.4022%2021.0043%2014.2245%2020.8265ZM18.5466%2021.3881C17.8002%2021.3881%2017.1889%2020.7768%2017.1889%2020.0304C17.1889%2019.2839%2017.8002%2018.6726%2018.5466%2018.6726C19.293%2018.6726%2019.9044%2019.2839%2019.9044%2020.0304C19.9044%2020.7839%2019.3002%2021.3881%2018.5466%2021.3881ZM18.5465%2019.5397C18.2763%2019.5397%2018.056%2019.7601%2018.056%2020.0302C18.056%2020.3003%2018.2763%2020.5207%2018.5465%2020.5207C18.8166%2020.5207%2019.037%2020.3003%2019.037%2020.0302C19.037%2019.7601%2018.8166%2019.5397%2018.5465%2019.5397ZM15.5324%2016.5256C15.5324%2016.2555%2015.312%2016.0351%2015.0419%2016.0351C14.7717%2016.0351%2014.5514%2016.2555%2014.5514%2016.5256C14.5514%2016.7957%2014.7717%2017.0161%2015.0419%2017.0161C15.312%2017.0161%2015.5324%2016.7957%2015.5324%2016.5256Z'%20fill='white'/%3e%3c/g%3e%3c/svg%3e) Financiación
Financiación '%3e%3cpath%20fill-rule='evenodd'%20clip-rule='evenodd'%20d='M10.4181%207.97583H18.0711V11.0371C18.0711%2011.5443%2018.4822%2011.9554%2018.9894%2011.9554H22.0508V15.2606C21.5692%2015.1023%2021.0546%2015.0166%2020.52%2015.0166C17.815%2015.0166%2015.6221%2017.2095%2015.6221%2019.9146C15.6221%2021.5539%2016.4274%2023.0051%2017.6641%2023.8942H10.4181C9.91092%2023.8942%209.49976%2023.483%209.49976%2022.9758V8.8942C9.49976%208.387%209.91092%207.97583%2010.4181%207.97583ZM18.9894%208.28195L21.7445%2011.0371H18.9894V8.28195ZM11.4893%2012.8738C11.2357%2012.8738%2011.0301%2013.0794%2011.0301%2013.333C11.0301%2013.5866%2011.2357%2013.7922%2011.4893%2013.7922H16.6934C16.947%2013.7922%2017.1526%2013.5866%2017.1526%2013.333C17.1526%2013.0794%2016.947%2012.8738%2016.6934%2012.8738H11.4893ZM11.4893%2015.3228C11.2357%2015.3228%2011.0301%2015.5283%2011.0301%2015.7819C11.0301%2016.0355%2011.2357%2016.2411%2011.4893%2016.2411H13.9383C14.1919%2016.2411%2014.3975%2016.0355%2014.3975%2015.7819C14.3975%2015.5283%2014.1919%2015.3228%2013.9383%2015.3228H11.4893ZM11.0301%2018.2309C11.0301%2017.9773%2011.2357%2017.7717%2011.4893%2017.7717H13.0199C13.2735%2017.7717%2013.4791%2017.9773%2013.4791%2018.2309C13.4791%2018.4845%2013.2735%2018.6901%2013.0199%2018.6901H11.4893C11.2357%2018.6901%2011.0301%2018.4845%2011.0301%2018.2309Z'%20fill='white'/%3e%3cg%20filter='url(%23filter0_d_5256_9725)'%3e%3cpath%20fill-rule='evenodd'%20clip-rule='evenodd'%20d='M20.5201%2023.8942C22.718%2023.8942%2024.4997%2022.1125%2024.4997%2019.9147C24.4997%2017.7168%2022.718%2015.9351%2020.5201%2015.9351C18.3223%2015.9351%2016.5405%2017.7168%2016.5405%2019.9147C16.5405%2022.1125%2018.3223%2023.8942%2020.5201%2023.8942ZM20.2955%2020.7661H22.3045C22.3933%2020.7661%2022.4784%2020.7308%2022.5412%2020.6681C22.604%2020.6053%2022.6393%2020.5201%2022.6393%2020.4313C22.6393%2020.3425%2022.604%2020.2573%2022.5412%2020.1945C22.4784%2020.1318%2022.3933%2020.0965%2022.3045%2020.0965H20.6303V17.7527C20.6303%2017.6639%2020.5951%2017.5787%2020.5323%2017.5159C20.4695%2017.4532%2020.3843%2017.4179%2020.2955%2017.4179C20.2067%2017.4179%2020.1216%2017.4532%2020.0588%2017.5159C19.996%2017.5787%2019.9607%2017.6639%2019.9607%2017.7527V20.4313C19.9607%2020.5201%2019.996%2020.6053%2020.0588%2020.6681C20.1216%2020.7308%2020.2067%2020.7661%2020.2955%2020.7661Z'%20fill='white'/%3e%3c/g%3e%3c/g%3e%3cdefs%3e%3cfilter%20id='filter0_d_5256_9725'%20x='10.4181'%20y='9.81261'%20width='20.2041'%20height='20.2041'%20filterUnits='userSpaceOnUse'%20color-interpolation-filters='sRGB'%3e%3cfeFlood%20flood-opacity='0'%20result='BackgroundImageFix'/%3e%3cfeColorMatrix%20in='SourceAlpha'%20type='matrix'%20values='0%200%200%200%200%200%200%200%200%200%200%200%200%200%200%200%200%200%20127%200'%20result='hardAlpha'/%3e%3cfeOffset/%3e%3cfeGaussianBlur%20stdDeviation='3.06122'/%3e%3cfeComposite%20in2='hardAlpha'%20operator='out'/%3e%3cfeColorMatrix%20type='matrix'%20values='0%200%200%200%200.554994%200%200%200%200%200.636366%200%200%200%200%201%200%200%200%200.3%200'/%3e%3cfeBlend%20mode='normal'%20in2='BackgroundImageFix'%20result='effect1_dropShadow_5256_9725'/%3e%3cfeBlend%20mode='normal'%20in='SourceGraphic'%20in2='effect1_dropShadow_5256_9725'%20result='shape'/%3e%3c/filter%3e%3c/defs%3e%3c/svg%3e) Flujo histórico
Flujo histórico '%3e%3cpath%20fill-rule='evenodd'%20clip-rule='evenodd'%20d='M15.0175%208.20618C15.3342%208.03088%2015.8476%208.03088%2016.1642%208.20618L22.8534%2011.9091C23.17%2012.0844%2023.17%2012.3686%2022.8534%2012.5439L16.1642%2016.2468C15.8476%2016.4221%2015.3342%2016.4221%2015.0175%2016.2468L8.32837%2012.5439C8.01172%2012.3686%208.01172%2012.0844%208.32837%2011.9091L15.0175%208.20618ZM9.93254%2014.5033L8.32847%2015.3912C8.01182%2015.5665%208.01182%2015.8507%208.32847%2016.026L15.0176%2019.729C15.3343%2019.9042%2015.8477%2019.9042%2016.1643%2019.729L22.8535%2016.026C23.1701%2015.8507%2023.1701%2015.5665%2022.8535%2015.3912L21.2494%2014.5033L16.1643%2017.3182C15.8477%2017.4935%2015.3343%2017.4935%2015.0176%2017.3182L9.93254%2014.5033ZM8.32847%2018.8734L9.93254%2017.9854L15.0176%2020.8004C15.3343%2020.9757%2015.8477%2020.9757%2016.1643%2020.8004L21.2494%2017.9854L22.8535%2018.8734C23.1701%2019.0487%2023.1701%2019.3329%2022.8535%2019.5082L16.1643%2023.2111C15.8477%2023.3864%2015.3343%2023.3864%2015.0176%2023.2111L8.32847%2019.5082C8.01182%2019.3329%208.01182%2019.0487%208.32847%2018.8734Z'%20fill='white'/%3e%3c/g%3e%3c/svg%3e) Categories And Statistics Of Fund Flow
Categories And Statistics Of Fund Flow  Interés Abierto Tiempo Real
  Total OI & Vol
  Volumen (24h)
  Exchange Vol
  Historial de tasas de financiación
  Binance
  Okx
Okx  Bitmex
  Bybit
Bybit  Gate
Gate  Bitfinex
  Deribit
  Bitget
  Kraken
  DYdX
DYdX '/%3e%3cdefs%3e%3cpattern%20id='pattern0_4449_9343'%20patternContentUnits='objectBoundingBox'%20width='1'%20height='1'%3e%3cuse%20xlink:href='%23image0_4449_9343'%20transform='scale(0.002)'/%3e%3c/pattern%3e%3cimage%20id='image0_4449_9343'%20width='500'%20height='500'%20xlink:href='data:image/png;base64,iVBORw0KGgoAAAANSUhEUgAAAEAAAABACAYAAACqaXHeAAAEMklEQVR4Xu2bv2/TQBTHu0FTmnjtBIIBCqR1k4YmRRWFAcYOLAxIVVc6dKhE/wDo2oqJoQhGBrrBwtQNBip1ZS1iJv8AUsi75qLL9872u7Njn0We9JGqxu/H9519ti+XqakcbObe0mKt0+jWOs0ej0aXfDBOqazWbp6gsEr9Vu/SzRux0DHo1+cM43tp1ZVwRy0cxbmixpxth5uYt3C70ll6MBzlu8mj7EplYX7YiMurS1exjkIs69HmIvNiPblZUcKR3BsRrIeBuBZbi1oxRUG1UE1UG9abqVXbjQ/iOl+8rRVRNDP9mqi26krjEOvOxOR9HBP7xuCS6GL9qcyX651LpvNCWUYeyeRMqHYah2UULxFzQn/eQl0sk7M9Bi0bzncHX2d7W+TdAfXFGjn4dJ9Pi3xOQJ2R5tupf+f5097bv79HwGOSYDfAN/H75z808a6NSGxC0A6v+dSAJPGS6xtPNF8TpI3eXFH30HwSv/XpSBMaR7DMm7MizwJaaPCpASiQA8YwIZ4NVpo7qP/itrcwrzkUAQqzAWMhcskN9Vuf/s/eH/Z2v30WMzR+lhYUZQPGMqE1oP+PM24DoiYm7jWYxNrLbS22LRgTIa20aKs2QDvIBCZCDv781HxswZguYEwTI2cBpwFzD+9riUzQ7I2+XDCWK1QrxkaGDQhWw5DTAEwSh+vlgHHSgLER0hy0wpBGn/W+jwmSQP8k0D8tGB8R8wCtF9Af0wnf2NCMjwk4YJwo0C8LMAdC31+Iy2Aco69CszrGyyp2HJjHRC4NUFnb2xZE3UqzBDWYyL0BeYIaTEwaMGnApAGTBuTagMev98RdYPf7F+2zrEENJoYNSHoQevH1o5bABoyngsdmBeZB1AehsTwKc4qQ7J+far5pwRwIaSbtY3kZIg66dq/G6J8GutQwPkKaxcsQ93UYkySB/hwwhisY14Q4/W3WAwhMFAX62YCxXMCYJkYbMNjThwchmMgE+tji+uYpmXvEWwyp4d5DTgMITKiy8eaVdrwLGNcGjGViZPTVBkwz9/hhUmLr2H0pDKHVZozPgTP6lfrFXkPUP0VfFnDPAoKS7f86FeBnWYDiOGAME6Rxtt3cRP3CbBqQBygwDvSNwjj60uSWV3QqEhRqAn2iIG2JW2x9awCBgiX0ToHHxhE7+qr52ASCnvC2jt+x1v0RtngyMVE4ru37CGmxagAZOVQWyr9JijZ6WYsn+++3yZHJzdEYtCxQ7bTZE3VZWY25XuAbVDPVjnqcbBBMS+Irsl7UkcrKciZkOvJocvO0j3cHOds7b47m2vAnMx49J8j7vPNs72K+zAtjud5trKhGFC5cNbnFVswP9fHtNZRr+eJ0by+vYx2FGy00yAKzPCvUmMZdnj5abfVi76EK52e16igrnGD8UlnQatGXLxY/n292yQfjjMP+AfgdCCcpRgjcAAAAAElFTkSuQmCC'/%3e%3c/defs%3e%3c/svg%3e) Hyperliquid
Hyperliquid  Huobi
Huobi '%3e%3cpath%20d='M17.0883%2014.7515L19.4161%2012.3924L20.3643%2013.3538L21.4377%209.00281L17.1476%2010.091L18.3444%2011.3043L16.015%2013.6633L13.8699%2011.4886L9.57812%2015.8397L10.6515%2016.9278L13.8699%2013.6633L16.015%2015.838L17.0883%2014.7515ZM21.2336%2015.7458H19.7174C19.2976%2015.7458%2018.9584%2016.0899%2018.9584%2016.5146V21.8979C18.9584%2022.3226%2019.2976%2022.6667%2019.7174%2022.6667H21.2336C21.6517%2022.6667%2021.9925%2022.3226%2021.9925%2021.8979V16.5146C21.9908%2016.0899%2021.6517%2015.7458%2021.2336%2015.7458ZM12.1298%2018.8227H10.612C10.1938%2018.8227%209.85305%2019.1667%209.85305%2019.5915V21.8979C9.85305%2022.3226%2010.1922%2022.6667%2010.612%2022.6667H12.1298C12.548%2022.6667%2012.8887%2022.3226%2012.8887%2021.8979V19.5915C12.8887%2019.1667%2012.5496%2018.8227%2012.1298%2018.8227ZM16.6817%2017.2834H15.1638C14.7457%2017.2834%2014.4049%2017.6275%2014.4049%2018.0522V21.8979C14.4049%2022.3226%2014.7441%2022.6667%2015.1638%2022.6667H16.6817C17.1015%2022.6667%2017.4406%2022.3226%2017.4406%2021.8979V18.0522C17.4406%2017.6275%2017.0998%2017.2834%2016.6817%2017.2834Z'%20fill='white'/%3e%3c/g%3e%3c/svg%3e) Índice de miedo y codicia
Índice de miedo y codicia '%3e%3cpath%20d='M10.0729%2020.9055H22.9029C23.1031%2020.9055%2023.295%2020.985%2023.4366%2021.1266C23.5781%2021.2681%2023.6576%2021.4601%2023.6576%2021.6602C23.6576%2021.8604%2023.5781%2022.0523%2023.4366%2022.1939C23.295%2022.3354%2023.1031%2022.4149%2022.9029%2022.4149H9.31818C9.10988%2022.4149%208.9207%2022.3304%208.78486%2022.1935C8.71464%2022.1236%208.65894%2022.0405%208.62095%2021.949C8.58296%2021.8574%208.56343%2021.7593%208.56348%2021.6602V10.088C8.56348%209.88789%208.64299%209.69593%208.78453%209.55439C8.92606%209.41286%209.11802%209.33334%209.31818%209.33334C9.51834%209.33334%209.71031%209.41286%209.85184%209.55439C9.99338%209.69593%2010.0729%209.88789%2010.0729%2010.088V20.9055Z'%20fill='white'/%3e%3cpath%20fill-rule='evenodd'%20clip-rule='evenodd'%20d='M24.163%2015.136C23.9284%2015.056%2023.659%2015.016%2023.355%2015.016C22.9124%2015.016%2022.5604%2015.0853%2022.299%2015.224C22.0377%2015.3573%2021.907%2015.5627%2021.907%2015.84C21.907%2015.968%2021.9364%2016.08%2021.995%2016.176C22.0537%2016.272%2022.1284%2016.352%2022.219%2016.416C22.331%2016.3413%2022.4697%2016.272%2022.635%2016.208C22.8057%2016.1387%2022.9977%2016.104%2023.211%2016.104C23.403%2016.104%2023.563%2016.1467%2023.691%2016.232C23.8244%2016.3173%2023.891%2016.4347%2023.891%2016.584C23.891%2016.6427%2023.8777%2016.704%2023.851%2016.768C23.8297%2016.832%2023.7897%2016.9013%2023.731%2016.976C23.6777%2017.0507%2023.6057%2017.136%2023.515%2017.232C23.4244%2017.3227%2023.3097%2017.4267%2023.171%2017.544L22.067%2018.488C21.9764%2018.5627%2021.8937%2018.664%2021.819%2018.792C21.7444%2018.9147%2021.707%2019.0667%2021.707%2019.248C21.707%2019.4187%2021.739%2019.568%2021.803%2019.696C21.8724%2019.8187%2021.9657%2019.92%2022.083%2020H24.859C24.9977%2020%2025.1097%2019.96%2025.195%2019.88C25.2804%2019.7947%2025.323%2019.656%2025.323%2019.464C25.323%2019.3573%2025.307%2019.2587%2025.275%2019.168C25.2484%2019.0773%2025.219%2019.0027%2025.187%2018.944H23.267L24.315%2018.104C24.9497%2017.5973%2025.267%2017.064%2025.267%2016.504C25.267%2016.296%2025.2244%2016.1013%2025.139%2015.92C25.0537%2015.7387%2024.9284%2015.5813%2024.763%2015.448C24.5977%2015.3147%2024.3977%2015.2107%2024.163%2015.136ZM19.4672%2020.0081C19.6272%2019.9601%2019.7446%2019.9041%2019.8193%2019.8401C19.8779%2019.7601%2019.9553%2019.6187%2020.0512%2019.4161C20.1472%2019.2081%2020.2486%2018.9707%2020.3552%2018.7041C20.4672%2018.4321%2020.5766%2018.1441%2020.6832%2017.8401C20.7952%2017.5361%2020.8939%2017.2454%2020.9792%2016.9681C21.0699%2016.6854%2021.1419%2016.4321%2021.1953%2016.2081C21.2539%2015.9841%2021.2832%2015.8134%2021.2832%2015.6961C21.2832%2015.4934%2021.2139%2015.3494%2021.0753%2015.2641C20.9366%2015.1734%2020.7686%2015.1281%2020.5712%2015.1281C20.4326%2015.1281%2020.3073%2015.1441%2020.1953%2015.1761C20.0886%2015.2081%2019.9873%2015.2481%2019.8913%2015.2961C19.7526%2015.8827%2019.6059%2016.4721%2019.4513%2017.0641C19.3019%2017.6561%2019.1552%2018.2027%2019.0113%2018.7041H18.9633C18.8033%2018.1867%2018.6486%2017.6907%2018.4993%2017.2161C18.3553%2016.7361%2018.2112%2016.2347%2018.0672%2015.7121C18.0086%2015.4881%2017.9153%2015.3361%2017.7873%2015.2561C17.6646%2015.1707%2017.5046%2015.1281%2017.3073%2015.1281C17.1472%2015.1281%2016.9952%2015.1601%2016.8512%2015.2241C16.7126%2015.2827%2016.6059%2015.3494%2016.5312%2015.4241C16.5899%2015.6587%2016.6592%2015.9094%2016.7392%2016.1761C16.8192%2016.4427%2016.9046%2016.7147%2016.9952%2016.9921C17.0859%2017.2694%2017.1793%2017.5441%2017.2753%2017.8161C17.3766%2018.0827%2017.4726%2018.3361%2017.5633%2018.5761C17.6593%2018.8161%2017.7499%2019.0347%2017.8353%2019.2321C17.9206%2019.4241%2017.9926%2019.5814%2018.0513%2019.7041C18.1099%2019.8214%2018.2193%2019.9147%2018.3793%2019.9841C18.5393%2020.0481%2018.7313%2020.0801%2018.9553%2020.0801C19.1419%2020.0801%2019.3126%2020.0561%2019.4672%2020.0081Z'%20fill='white'/%3e%3cpath%20d='M20.4247%2010.0088C14.7676%2010.2619%2012.1359%2015.9398%2011.724%2018.9636C11.6843%2019.2549%2011.9755%2019.3632%2012.1509%2019.1272C12.5214%2018.6284%2013.0575%2017.8868%2013.666%2017.0754C16.6762%2013.0612%2018.8483%2012.8271%2020.3464%2013.0515C21.2794%2013.1913%2021.9993%2012.593%2021.9993%2011.6495C21.9993%2010.75%2021.3233%209.96855%2020.4247%2010.0088Z'%20fill='white'/%3e%3c/g%3e%3c/svg%3e) BTC Rainbow Chart
BTC Rainbow Chart '%3e%3cpath%20d='M14.0128%2019.9997H11.6009L11.3265%2018.5843H9.62226L9.34785%2019.9997H7.0515L8.69794%2011.0309H12.3663L14.0128%2019.9997ZM11.0521%2016.8946L10.5466%2013.6884H10.4455L9.93999%2016.8946H11.0521ZM17.0319%2013.5873C17.5615%2013.1347%2018.1343%2012.9085%2018.7506%2012.9085C19.3668%2012.9085%2019.8%2013.0577%2020.0504%2013.3562C20.3103%2013.645%2020.4403%2014.0831%2020.4403%2014.6704V19.9997H17.9851V15.4937C17.9851%2015.2529%2017.8792%2015.1326%2017.6674%2015.1326C17.3978%2015.1326%2017.1715%2015.2%2016.9886%2015.3348V19.9997H14.5622V10.7421H16.9741V13.5873H17.0319ZM23.7014%2016.1147V19.9997H21.3039V13.0818H23.4125L23.5569%2013.5006H23.6147C23.8362%2013.2503%2024.0576%2013.0914%2024.2791%2013.024C24.5101%2012.947%2024.8808%2012.9085%2025.3911%2012.9085L25.29%2015.2192H24.6257C24.2502%2015.2192%2023.9998%2015.277%2023.8747%2015.3926C23.7591%2015.5081%2023.7014%2015.7488%2023.7014%2016.1147Z'%20fill='white'/%3e%3c/g%3e%3c/svg%3e) Índice Bitcoin Ahr999
Índice Bitcoin Ahr999 '%3e%3cpath%20d='M21.0547%2010H18.9609C18.8802%2010%2018.8008%2010.0195%2018.7293%2010.0569C18.6578%2010.0943%2018.5964%2010.1484%2018.5503%2010.2147L16.0534%2013.8084L13.5566%2010.2147C13.5108%2010.1488%2013.4498%2010.0949%2013.3787%2010.0575C13.3077%2010.0201%2013.2287%2010.0004%2013.1484%2010H11.0547C10.9221%2010%2010.7949%2010.0527%2010.7011%2010.1464C10.6074%2010.2402%2010.5547%2010.3674%2010.5547%2010.5V12C10.5547%2012.1326%2010.6074%2012.2598%2010.7011%2012.3536C10.7949%2012.4473%2010.9221%2012.5%2011.0547%2012.5H12.1009L14.5325%2016L12.1009%2019.5H11.0547C10.9221%2019.5%2010.7949%2019.5527%2010.7011%2019.6464C10.6074%2019.7402%2010.5547%2019.8674%2010.5547%2020V21.5C10.5547%2021.6326%2010.6074%2021.7598%2010.7011%2021.8536C10.7949%2021.9473%2010.9221%2022%2011.0547%2022H13.1484C13.2291%2022%2013.3086%2021.9805%2013.3801%2021.9431C13.4516%2021.9057%2013.513%2021.8516%2013.5591%2021.7853L16.0559%2018.1916L18.5528%2021.7853C18.5986%2021.8512%2018.6596%2021.9051%2018.7306%2021.9425C18.8017%2021.9799%2018.8807%2021.9996%2018.9609%2022H21.0547C21.1873%2022%2021.3145%2021.9473%2021.4082%2021.8536C21.502%2021.7598%2021.5547%2021.6326%2021.5547%2021.5V20C21.5547%2019.8674%2021.502%2019.7402%2021.4082%2019.6464C21.3145%2019.5527%2021.1873%2019.5%2021.0547%2019.5H20.0084L17.5769%2016L20.0084%2012.5H21.0547C21.1873%2012.5%2021.3145%2012.4473%2021.4082%2012.3536C21.502%2012.2598%2021.5547%2012.1326%2021.5547%2012V10.5C21.5547%2010.3674%2021.502%2010.2402%2021.4082%2010.1464C21.3145%2010.0527%2021.1873%2010%2021.0547%2010Z'%20fill='white'/%3e%3c/g%3e%3c/svg%3e) Multiplicador MA de 2 años
Multiplicador MA de 2 años '%3e%3cpath%20d='M7.0645%2018.5502C7.02153%2018.619%207%2018.6877%207%2018.7565V20.0418C7%2020.751%209.32123%2021.327%2012.184%2021.327C12.8201%2021.327%2013.422%2021.3012%2013.9807%2021.2497V19.5561C13.422%2019.6076%2012.8201%2019.6335%2012.184%2019.6335C9.6049%2019.6335%207.45989%2019.1649%207.0645%2018.5502ZM7.04718%2016.3623C7.01709%2016.4182%207%2016.4783%207%2016.5386V17.8194C7%2018.5331%209.32123%2019.109%2012.184%2019.109C12.8201%2019.109%2013.422%2019.079%2013.9807%2019.0273V17.3895C13.422%2017.4412%2012.8201%2017.4713%2012.184%2017.4713C9.56181%2017.4713%207.39555%2016.9856%207.04718%2016.3623ZM14.0065%2015.249C13.439%2015.3006%2012.8288%2015.3307%2012.1839%2015.3307C9.53611%2015.3307%207.34814%2014.8363%207.03865%2014.2002C7.01282%2014.2517%207%2014.3034%207%2014.357V15.6445C7%2016.3494%209.32123%2016.9254%2012.184%2016.9254C12.8201%2016.9254%2013.422%2016.8996%2013.9807%2016.8481V15.9452H13.9807V15.3694C13.9807%2015.3307%2013.9893%2015.2876%2014.0065%2015.249Z'%20fill='white'/%3e%3cpath%20d='M12.184%2014.8044C13.164%2014.8044%2014.0839%2014.7378%2014.8662%2014.6196C15.3047%2014.452%2015.8849%2014.3102%2016.5641%2014.2092C17.0756%2014.0092%2017.3723%2013.7728%2017.3723%2013.5192V12.234C17.3723%2012.2146%2017.3701%2012.1953%2017.368%2012.176C17.2433%2012.8594%2014.9694%2013.4032%2012.184%2013.4032C9.39855%2013.4032%207.12897%2012.8594%207.00427%2012.176C7%2012.1953%207%2012.2146%207%2012.234V13.5192C7%2014.2285%209.32123%2014.8044%2012.184%2014.8044Z'%20fill='white'/%3e%3cpath%20d='M12.184%2012.8557C15.0511%2012.8557%2017.3723%2012.2797%2017.3723%2011.5705V10.2853C17.3723%209.57604%2015.0511%209%2012.184%209C9.32126%209%207%209.57602%207%2010.2852V11.5705C7%2012.2797%209.32123%2012.8557%2012.184%2012.8557ZM19.8116%2021.2313C17.2282%2021.2313%2015.0897%2020.7628%2014.6943%2020.1481C14.6512%2020.2169%2014.6255%2020.2857%2014.6255%2020.3545V21.6397C14.6255%2022.3489%2016.9466%2022.925%2019.8116%2022.925C22.6766%2022.925%2024.9999%2022.3489%2024.9999%2021.6397V20.3545C24.9999%2020.2857%2024.9763%2020.2169%2024.9333%2020.1481C24.5378%2020.7628%2022.3972%2021.2313%2019.8116%2021.2313Z'%20fill='white'/%3e%3cpath%20d='M19.8111%2019.0705C17.1868%2019.0705%2015.0204%2018.5891%2014.6765%2017.9615C14.6421%2018.0175%2014.625%2018.0775%2014.625%2018.1378V19.4231C14.625%2020.1323%2016.9461%2020.7083%2019.8111%2020.7083C22.6761%2020.7083%2024.9994%2020.1323%2024.9994%2019.4231V18.1378C24.9994%2018.0776%2024.9822%2018.0175%2024.95%2017.9615C24.6039%2018.589%2022.4375%2019.0705%2019.8111%2019.0705Z'%20fill='white'/%3e%3cpath%20d='M19.8111%2014.67C16.9461%2014.67%2014.625%2015.2481%2014.625%2015.9531V17.2426C14.625%2017.9476%2016.9461%2018.5237%2019.8111%2018.5237C22.6761%2018.5237%2024.9994%2017.9476%2024.9994%2017.2426V15.9531C24.9994%2015.2481%2022.6761%2014.67%2019.8111%2014.67Z'%20fill='white'/%3e%3c/g%3e%3c/svg%3e) Múltiplo Puell
Múltiplo Puell '%3e%3cpath%20d='M10.0729%2020.9055H22.9029C23.1031%2020.9055%2023.295%2020.985%2023.4366%2021.1266C23.5781%2021.2681%2023.6576%2021.4601%2023.6576%2021.6602C23.6576%2021.8604%2023.5781%2022.0523%2023.4366%2022.1939C23.295%2022.3354%2023.1031%2022.4149%2022.9029%2022.4149H9.31818C9.10988%2022.4149%208.9207%2022.3304%208.78486%2022.1935C8.71464%2022.1236%208.65894%2022.0405%208.62095%2021.949C8.58296%2021.8574%208.56343%2021.7593%208.56348%2021.6602V10.088C8.56348%209.88789%208.64299%209.69593%208.78453%209.55439C8.92606%209.41286%209.11802%209.33334%209.31818%209.33334C9.51834%209.33334%209.71031%209.41286%209.85184%209.55439C9.99338%209.69593%2010.0729%209.88789%2010.0729%2010.088V20.9055Z'%20fill='white'/%3e%3cpath%20d='M20.4257%2010.6001C14.7686%2010.8532%2012.1369%2016.5311%2011.725%2019.5549C11.6853%2019.8463%2011.9765%2019.9545%2012.1519%2019.7185C12.5224%2019.2197%2013.0585%2018.4781%2013.667%2017.6667C16.6772%2013.6525%2018.8493%2013.4184%2020.3474%2013.6428C21.2804%2013.7826%2022.0003%2013.1843%2022.0003%2012.2408C22.0003%2011.3413%2021.3243%2010.5599%2020.4257%2010.6001Z'%20fill='white'/%3e%3c/g%3e%3c/svg%3e) Retornos Bitcoin (%)
Retornos Bitcoin (%) '%3e%3cpath%20fill-rule='evenodd'%20clip-rule='evenodd'%20d='M19.4564%209.4617C19.2513%209.37679%2019.0314%209.33314%2018.8094%209.33325H10.3583C10.1363%209.33314%209.91641%209.37679%209.71128%209.4617C9.50616%209.5466%209.31978%209.67111%209.1628%209.82808C9.00582%209.98506%208.88132%2010.1714%208.79641%2010.3766C8.71151%2010.5817%208.66786%2010.8015%208.66797%2011.0235V19.4747C8.66786%2019.6967%208.71151%2019.9166%208.79641%2020.1217C8.88132%2020.3268%209.00582%2020.5132%209.1628%2020.6702C9.31978%2020.8272%209.50616%2020.9517%209.71128%2021.0366C9.91641%2021.1215%2010.1363%2021.1651%2010.3583%2021.165H16.2741V19.0521C16.2741%2017.8851%2017.9776%2016.9394%2020.0771%2016.9394C20.2181%2016.9388%2020.3591%2016.9432%2020.4997%2016.9526V11.0235C20.4998%2010.8015%2020.4562%2010.5817%2020.3713%2010.3766C20.2864%2010.1714%2020.1619%209.98506%2020.0049%209.82808C19.8479%209.67111%2019.6615%209.5466%2019.4564%209.4617ZM15.64%2015.0908L17.9642%2012.7668L18.8093%2013.6121L15.4287%2016.9922L13.5273%2015.0908L11.2031%2017.4151L10.3581%2016.5698L13.7387%2013.1895L14.5834%2014.0342L15.64%2015.0908Z'%20fill='white'/%3e%3cpath%20d='M23.1627%2022.307C23.2205%2022.4066%2023.2507%2022.5114%2023.2507%2022.6195C23.2507%2023.3355%2021.8961%2023.9166%2020.224%2023.9166C18.5519%2023.9166%2017.1973%2023.3355%2017.1973%2022.6195C17.1973%2022.5114%2017.2275%2022.4066%2017.2853%2022.307C17.9996%2022.7629%2019.0502%2023.0518%2020.224%2023.0518C21.3978%2023.0518%2022.45%2022.7629%2023.1627%2022.307ZM23.1627%2020.5773C23.2205%2020.6769%2023.2507%2020.7818%2023.2507%2020.8899C23.2507%2021.6061%2021.8961%2022.187%2020.224%2022.187C18.5519%2022.187%2017.1973%2021.6061%2017.1973%2020.8899C17.1973%2020.7818%2017.2275%2020.6769%2017.2853%2020.5773C17.9996%2021.0335%2019.0502%2021.3222%2020.224%2021.3222C21.3978%2021.3222%2022.45%2021.0333%2023.1627%2020.5773ZM20.224%2017.8632C21.8961%2017.8632%2023.2507%2018.4443%2023.2507%2019.1603C23.2507%2019.8765%2021.8961%2020.4574%2020.224%2020.4574C18.5519%2020.4574%2017.1973%2019.8765%2017.1973%2019.1603C17.1973%2018.4443%2018.5519%2017.8632%2020.224%2017.8632Z'%20fill='white'/%3e%3c/g%3e%3c/svg%3e) Índice Altcoin
Índice Altcoin '%3e%3cpath%20fill-rule='evenodd'%20clip-rule='evenodd'%20d='M22.64%2015.6528C22.64%2016.3846%2022.5294%2017.0993%2022.3167%2017.7631C22.6656%2018.2906%2022.8698%2018.9118%2022.8698%2019.5755C22.8698%2021.3965%2021.3977%2022.8686%2019.5767%2022.8686C18.896%2022.8686%2018.2663%2022.6644%2017.7473%2022.3155C17.0835%2022.5282%2016.3858%2022.6388%2015.654%2022.6388C11.8079%2022.6388%208.66797%2019.5074%208.66797%2015.6528C8.66797%2011.8066%2011.8079%208.66675%2015.654%208.66675C19.5002%208.66675%2022.64%2011.7981%2022.64%2015.6528ZM15.4153%2018.9974V18.206C16.5895%2017.9848%2016.981%2017.1934%2016.9725%2016.4446C16.9725%2015.7469%2016.7172%2015.1853%2015.7556%2014.6492L14.7005%2014.0706C14.1389%2013.7557%2013.9857%2013.577%2013.9857%2013.2877C13.9857%2012.9133%2014.258%2012.6751%2014.9047%2012.6751C15.4748%2012.6751%2016.0535%2012.7091%2016.6321%2012.7687H16.6661C16.7427%2012.7516%2016.8108%2012.6751%2016.8023%2012.5985V11.9518C16.8023%2011.8582%2016.7257%2011.8071%2016.6321%2011.7816C16.2237%2011.705%2015.8152%2011.6625%2015.3983%2011.6369V10.9392C15.3898%2010.8371%2015.3217%2010.7605%2015.2196%2010.7605H14.4282C14.3261%2010.769%2014.2495%2010.8371%2014.2495%2010.9392V11.671C13.1518%2011.8497%2012.7604%2012.4794%2012.7604%2013.2877C12.7604%2013.9004%2012.9817%2014.4024%2013.7985%2014.8875L14.9558%2015.5682C15.5344%2015.9086%2015.7046%2016.0958%2015.7046%2016.4276C15.7046%2016.9382%2015.4834%2017.219%2014.7005%2017.219C14.3687%2017.219%2013.5007%2017.1679%2013.1518%2017.1254H13.1263C13.0327%2017.1254%2012.9561%2017.2019%2012.9561%2017.2955V17.9252C12.9561%2018.0273%2013.0327%2018.0954%2013.1263%2018.1039C13.5007%2018.1805%2013.8836%2018.223%2014.2665%2018.2486V18.9974C14.2751%2019.0995%2014.3431%2019.1761%2014.4452%2019.1761H15.2366C15.3387%2019.1676%2015.4153%2019.0995%2015.4153%2018.9974ZM17.1256%2019.5845C17.1256%2020.929%2018.2233%2022.0267%2019.5678%2022.0267C20.9207%2022.0267%2022.0099%2020.929%2022.0099%2019.5845C22.0099%2018.2401%2020.9122%2017.1424%2019.5678%2017.1424C18.2233%2017.1424%2017.1256%2018.2401%2017.1256%2019.5845Z'%20fill='white'/%3e%3cpath%20d='M18.7158%2021.1835C18.6216%2021.1835%2018.5347%2021.1472%2018.4622%2021.0748C18.3173%2020.9298%2018.3173%2020.7052%2018.4622%2020.5603L19.3535%2019.669V18.1762C19.3535%2017.9733%2019.5129%2017.8139%2019.7158%2017.8139C19.9187%2017.8139%2020.0782%2017.9733%2020.0782%2018.1762V19.8139C20.0782%2019.9153%2020.0419%2020.0095%2019.9695%2020.0748L18.9695%2021.0675C18.9042%2021.14%2018.8173%2021.1835%2018.7158%2021.1835Z'%20fill='white'/%3e%3c/g%3e%3c/svg%3e) Precio histórico de Bitcoin
Precio histórico de Bitcoin '%3e%3cpath%20d='M14.9958%2012.8875V12.3125H16.4333V12.8875C17.1042%2013.0792%2017.775%2013.3667%2018.1583%2013.9417L18.6375%2013.6542L19.4042%2014.9L18.925%2015.1875C19.0208%2015.475%2019.1167%2015.8583%2019.1167%2016.2417C19.1167%2016.625%2019.0208%2016.9125%2018.925%2017.2958L19.4042%2017.5833L18.6375%2018.8292L18.1583%2018.5417C17.6792%2019.0208%2017.1042%2019.4042%2016.4333%2019.5958V19.9792H14.9958V19.4042C14.325%2019.2125%2013.6542%2018.925%2013.2708%2018.35L12.7917%2018.6375L12.025%2017.3917L12.5042%2017.1042C12.4083%2016.8167%2012.3125%2016.4333%2012.3125%2016.05C12.3125%2015.6667%2012.4083%2015.3792%2012.5042%2014.9958L12.025%2014.7083L12.7917%2013.6542L13.2708%2013.9417C13.75%2013.3667%2014.325%2012.9833%2014.9958%2012.8875ZM18.6375%2024.0042L16.4333%2021.8C19.3083%2021.4167%2021.4167%2019.0208%2021.4167%2016.1458C21.4167%2013.3667%2019.4042%2011.0667%2016.8167%2010.4917L14.8042%208.47917H15.6667C19.8833%208.47917%2023.3333%2011.9292%2023.3333%2016.1458C23.3333%2019.0208%2021.8%2021.4167%2019.5%2022.7583V24.8667L18.6375%2024.0042ZM16.625%2023.7167C16.3375%2023.7167%2015.9542%2023.8125%2015.6667%2023.8125C11.45%2023.8125%208%2020.3625%208%2016.1458C8%2013.2708%209.53333%2010.875%2011.8333%209.53334V7.23334L13.175%208.575L14.9958%2010.3958C12.1208%2010.7792%209.91667%2013.175%209.91667%2016.1458C9.91667%2019.0208%2012.025%2021.3208%2014.7083%2021.8L16.625%2023.7167ZM15.7625%2018.0625C16.8167%2018.0625%2017.6792%2017.2%2017.6792%2016.1458C17.6792%2015.0917%2016.8167%2014.2292%2015.7625%2014.2292C14.7083%2014.2292%2013.8458%2015.0917%2013.8458%2016.1458C13.8458%2017.2%2014.7083%2018.0625%2015.7625%2018.0625ZM15.7625%2017.1042C15.1875%2017.1042%2014.8042%2016.7208%2014.8042%2016.1458C14.8042%2015.5708%2015.1875%2015.1875%2015.7625%2015.1875C16.3375%2015.1875%2016.7208%2015.5708%2016.7208%2016.1458C16.7208%2016.7208%2016.2417%2017.1042%2015.7625%2017.1042Z'%20fill='white'/%3e%3c/g%3e%3c/svg%3e) Indicador de cima del ciclo Pi
Indicador de cima del ciclo Pi '%3e%3cpath%20d='M15.9101%2011.955H14.4476V10.252C14.4476%2010.252%2014.44%2010%2014.1956%2010H13.9627C13.9627%2010%2013.7145%2010.0115%2013.7145%2010.252V11.9512H12.2558C12.2558%2011.9512%2012%2011.9474%2012%2012.2032V18.0645C12%2018.0645%2012.0535%2018.3089%2012.2482%2018.3089H13.7145V20.0195C13.7145%2020.0195%2013.7221%2020.2677%2013.9627%2020.2677H14.2032C14.2032%2020.2677%2014.4476%2020.2601%2014.4476%2020.0195V18.3127L15.9101%2018.3089C15.9101%2018.3089%2016.1544%2018.3089%2016.1544%2018.0645V12.2032C16.1544%2012.2032%2016.1544%2011.955%2015.9101%2011.955ZM21.042%2012.9325H19.8239V11.2295C19.8239%2011.2295%2019.8163%2010.9775%2019.5719%2010.9775H19.339C19.339%2010.9775%2019.0908%2010.989%2019.0908%2011.2295V12.9287H17.8766C17.8766%2012.9287%2017.6207%2012.9249%2017.6207%2013.1807V16.1095C17.6207%2016.1095%2017.6742%2016.3539%2017.8689%2016.3539H19.0908V17.5757C19.0908%2017.5757%2019.0984%2017.8239%2019.339%2017.8239H19.5796C19.5796%2017.8239%2019.8239%2017.8163%2019.8239%2017.5757V16.3577L21.042%2016.3538C21.042%2016.3538%2021.2864%2016.3538%2021.2864%2016.1095V13.1807C21.2864%2013.1807%2021.2864%2012.9325%2021.042%2012.9325Z'%20fill='white'/%3e%3cpath%20d='M8.5%208.5V22.5H23.5'%20stroke='white'/%3e%3c/g%3e%3c/svg%3e) Pro Chart
Pro Chart 
'%3e%3cpath%20d='M14.8576%2011.0465H12.5787V8.39272C12.5787%208.39272%2012.5668%208%2012.186%208H11.823C11.823%208%2011.4363%208.01784%2011.4363%208.39272V11.0405H9.1633C9.1633%2011.0405%208.76465%2011.0346%208.76465%2011.4333V20.5668C8.76465%2020.5668%208.84795%2020.9476%209.15141%2020.9476H11.4363V23.6132C11.4363%2023.6132%2011.4482%2024%2011.823%2024H12.1979C12.1979%2024%2012.5787%2023.9881%2012.5787%2023.6132V20.9535L14.8576%2020.9476C14.8576%2020.9476%2015.2384%2020.9476%2015.2384%2020.5667V11.4332C15.2384%2011.4332%2015.2384%2011.0465%2014.8576%2011.0465ZM22.8546%2012.5697H20.9565V9.91595C20.9565%209.91595%2020.9446%209.52323%2020.5638%209.52323H20.2009C20.2009%209.52323%2019.8141%209.54108%2019.8141%209.91595V12.5638H17.922C17.922%2012.5638%2017.5233%2012.5578%2017.5233%2012.9565V17.5203C17.5233%2017.5203%2017.6066%2017.9011%2017.9101%2017.9011H19.8141V19.8051C19.8141%2019.8051%2019.826%2020.1919%2020.2009%2020.1919H20.5757C20.5757%2020.1919%2020.9566%2020.18%2020.9566%2019.8051V17.907L22.8547%2017.9011C22.8547%2017.9011%2023.2355%2017.9011%2023.2355%2017.5203V12.9565C23.2355%2012.9565%2023.2355%2012.5697%2022.8546%2012.5697Z'%20fill='white'/%3e%3c/g%3e%3c/svg%3e) Live Chart
Live Chart

The altcoin index rebounds, and the correlation between BTC and the S&P 500 decreases, may it reach a ATH?

Catalogue:
1. BTC contract clearing map, intuitively reflecting the location of risk control;
2. Analysis of altcoin index trading;
3. Token RSI overbought and oversold situation.
4. Hot topic interpretation: Will the correlation between BTC and the S&P 500 decrease, or will it reach a historical high?

1. BTC contract clearing map, intuitively reflecting the main risk control positions
According to the latest data from the CoinAnk contract clearing map, if the BTC price rises above $104000, there will be $904.8 million worth of empty positions cleared;
If the BTC price falls below $98200, there will be multiple orders worth $2.144 billion cleared.
These data intuitively reflect the risk control position of the main funds and can also serve as trading or intervention references.

2. Analysis of altcoin index trading.
According to the CoinAnk index, the latest value of the altcoin index is around 59, with the lowest value of 43 in this round. It has been fluctuating below 50 for more than ten days. Since January 1st of the new year, there has been a significant rebound, breaking through the 50 long short balance position and rising steadily. The performance of altcoins is also quite obvious, and there has been a certain degree of rebound recently.
We analyzed the Shanshan Zhai Coin Index in the early stage. Generally, if the Shanzhai Coin Index is below 25, it is a good time to intervene in the ambush. If you are worried about missing the market, you can also start to intervene in batches after falling below the median value of 50. Positions can be built in a pyramid pattern. If the current round of light position intervention is below 50, according to the overall increase of the top 50 altcoins in terms of market value, it is slightly larger than BTC, which is also a better profit.
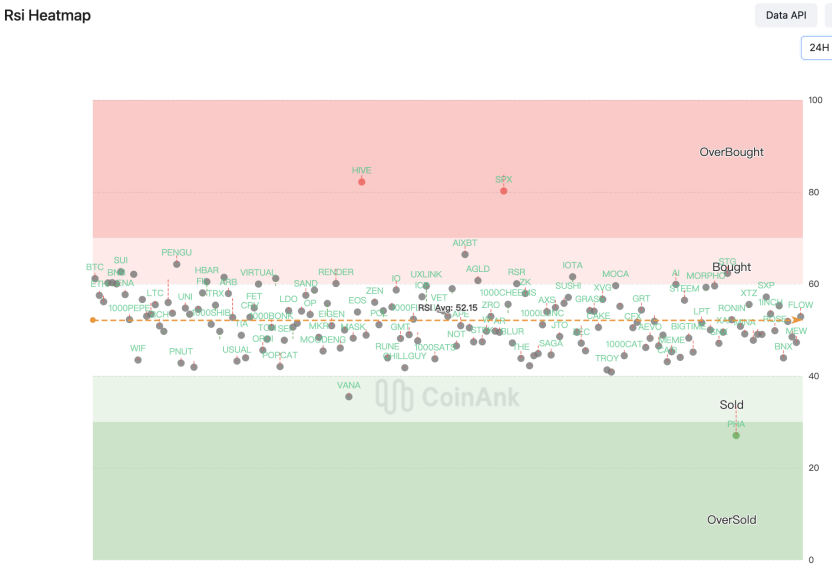
3. Token RSI overbought and oversold situation:
According to the CoinAnk RSI indicator filter, at the daily level, HIVE, SPX, and AIXBT are already in or near overbought areas with recent price increases. If they rise to a critical point or resistance level, they may face a pullback in the future; PHA、VANA、 After the recent price drop, it is already in or close to the oversold area. If it falls to the important support area below, it may face a rebound market in the future.
Of course, overbought and oversold indicators tend to have a left-hand trading mindset, which is a subjective counter trend thinking of guessing the bottom and escaping the top. The Matthew effect and right-hand trading mindset are completely opposite to this, because the strong are always strong and the weak are always weak. The objective trend trading mindset may allow overbought and oversold tokens to continue their recent strong or weak trend.
4. Hot topic interpretation: Will the correlation between BTC and the S&P 500 decrease, or will it reach a historical high?
Since Trump was elected as the 47th President of the United States, the correlation between cryptocurrency and the stock market has been high. However, now we are starting to see Bitcoin outperforming the S&P 500 index (compared to their normal range of volatility). In the past three years, most communities have viewed cryptocurrency as a ‘highly leveraged technology stock’. However, signs at the beginning of 2025 suggest that Bitcoin may break free from its conventional linkage with the global stock market. In history, when the correlation between the cryptocurrency market and the stock market is low or even unrelated, the most significant bull market usually occurs. If Bitcoin and other altcoins can continue to grow without relying on the S&P 500 index in January this year, it will be a strong signal that there is a high possibility of reaching new historical highs.
We believe that the correlation between Bitcoin and the S&P 500 index will change in early 2025, and Bitcoin will begin to show a trend leading the traditional stock market. This phenomenon may be related to the gradual maturity of Bitcoin and the formation of independent market dynamics. In history, periods of low correlation between the cryptocurrency market and the stock market were often accompanied by significant bull markets for Bitcoin, which may indicate that Bitcoin is forming its own value storage and investment case, rather than just representing high-risk technology stocks. There are many predictions in the market that the price of Bitcoin will rise even higher by 2025. These predictions, coupled with the continued growth of Bitcoin ETFs and the recovery of market sentiment, indicate that investors’ confidence in Bitcoin remains strong. If Bitcoin can continue to grow independently of the S&P 500 index, it will be a strong signal of market recognition of its long-term potential, potentially heralding the realization of new historical highs.